Where We Have Been, Where We Are, Where We Are Maybe Going

Over long time periods stocks have delivered around 6%+ REAL returns (accounting for inflation). Additionally, the longer the time horizon the more predictable those returns get – the range between the Max and Min returns narrows and % Positive and over 4% increases.
S&P 500 Real Total Returns
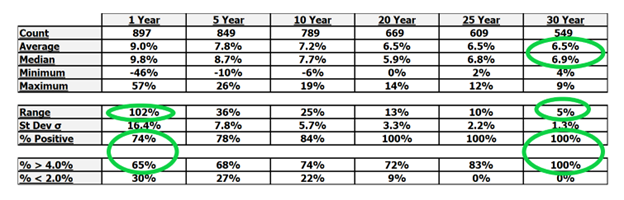
Source: Robert Shiller, Yahoo! Finance, Capital Advisors Ltd: Oct-1946 to Jun-2022
The reason for this is relatively straight forward – over time companies generally make more money (see how the price and earnings line move together and ultimately converge) and increase their dividends.
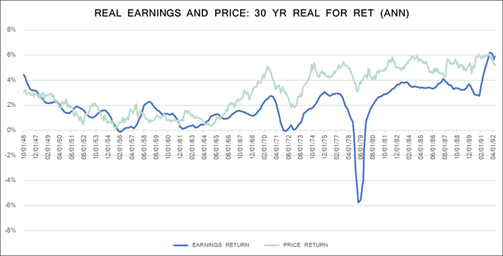
Source: Robert Shiller, Yahoo! Finance, Capital Advisors Ltd: Oct-1946 to Jun-2022
Source: Robert Shiller, Yahoo! Finance, Capital Advisors Ltd: Oct-1946 to Jun-2022; Dividend Growth = REAL
Thus, despite the recent uncertainty with regard to inflation/interest rates and the subsequent market volatility I believe there is a high degree of confidence holding stocks for a long period of time will reward investors.
Given the long-term viability of stocks has been established, let’s take a look at where we are currently:
- The S&P 500 was down from its all-time high about 23% on 06/17/22
- At that point, as measured over the last 5 years, the market had only been more oversold about 7 trading days
- It then rallied almost 7% through Friday 06/24/22
- Then fell ~3% from there through the end of the month and coming up slighly since then
- As such we are currently off around 20% from the all-time high (through 07/05/22)
- While we bounced off a wildly oversold market, the question becomes is it sustainable?
How did we get here?
- Most importantly, the market has been pricing a much more hawkish Federal Reserve (i.e. significantly raising interest rates)
- The reason for the market pricing in further Fed hikes is that inflation has been increasing substantially, currently Headline Inflation is around 9%
- The market is ultimately assuming the Fed Rate hikes and inflation will hit earnings (though interestingly enough this hasn’t shown up in data) and the economy may potentially go into a recession
What happens next? In the short-term, it’s anyone’s guess but in the long run please see above. That said, here are some things that have been happening.
Inflation pressures have subsided in the TIPS Spreads and Core CPINew Paragraph
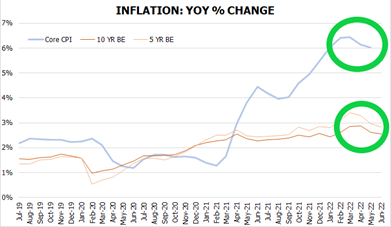
Source: Capital Advisors, Ltd., FRED
- Commodity prices have also started to ease
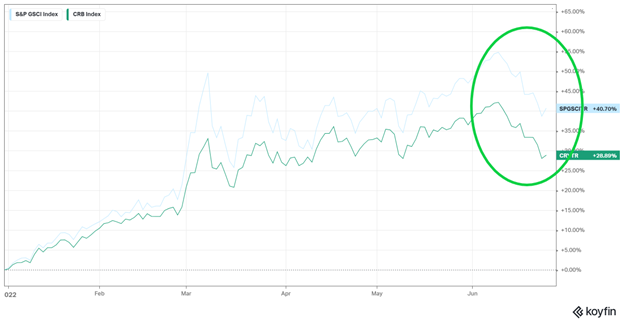
Source: Koyfin (SPG = S&P GSCI; CRY = CRB Index)
- Bond yields have come down, indicating slower growth or lower inflation or a more dovish Fed or a combination of the 3
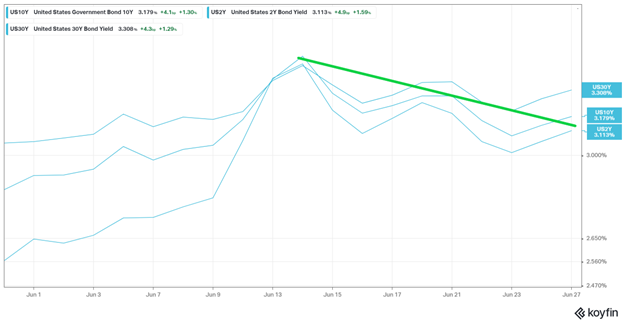
Source: Koyfin
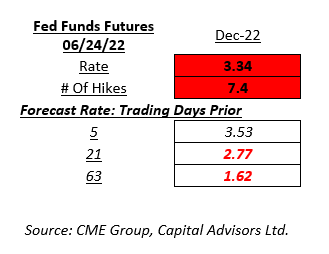
- It’s important to remember that markets look forward, thus while the Fed will be tightening into the future a lot of that tightening has already taken place today based on the future path of the Fed!
- It’s important to remember that markets look forward, thus while the Fed will be tightening into the future a lot of that tightening has already taken place today based on the future path of the Fed!
Source: Kirtland Hills Capital Management
- Will we enter a recession? The jury is still out with Wall Street Journal Economist poll putting it at a 44% chance over the next 12 months.
Let’s summarize some of the key points above:
- 1) The market priced in extreme Fed tightening due to high inflation
- 2) This led to the market to move down to an extremely oversold condition
- 3) Inflation however is starting to roll over – commodities, rates, breakeven spreads, Core CPI
- 4) This provides the conditions for a more dovish Fed, which is likely to be a tailwind for stocks
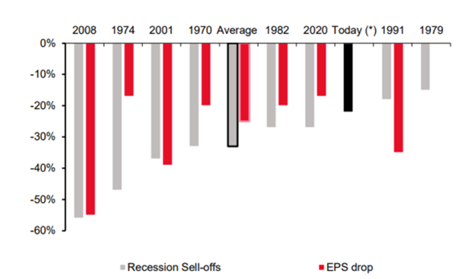
- 5) Relative to history, the market overall has priced in a borderline recession based on the 23% drop and thus even if/when earnings get cut anything less than 15% is likely already priced in
- 6) The 2 main near-term risks to the market: recent Inflation/Commodity declines are NOT sustainable and/or we enter a recession in the next 6 to 12 months
- 7) The market is likely to maintain a higher level of volatility while it weighs these 2 risks
- 8) Additionally, there is a possibility the Fed becomes more dovish and the market rallies for the next 6+ plus months and then ultimately a recession happens
- 9) Forget about 1-8 and focus on buying and holding stocks for the long-run where the probabilities of success are substantially in your favor!
The views and opinions expressed herein are those of the author(s) noted and may or may not represent the views of Capital Analysts or Lincoln Investment. The material presented is provided for informational purposes only. Nothing contained herein should be construed as a recommendation to buy or sell any securities. No person or system can predict the market.
Past performance is not indicative of future results.
S&P 500: The index measures the performance of 500 widely held stocks in the US equity market. Standard and Poor's chooses member companies for the index based on market size, liquidity and industry group representation. It is market capitalization-weighted. Investors cannot invest directly in an index.
Equal weight is a type of weighting that gives the same weight, or importance, to each stock in a portfolio or index fund, and the smallest companies are given equal weight to the largest companies in an equal-weight index fund or portfolio.
Investing involves risk, including the loss of principal. There are some risks associated with investing in the stock markets: 1) Systematic risk - also known as market risk, this is the potential for the entire market to decline; 2) Unsystematic risk - the risk that any one stock may go down in value, independent of the stock market as a whole. This also incorporates business risk and event risk; and 3) Opportunity risk and liquidity risk.
Projections or other information regarding the likelihood of various outcomes are hypothetical in nature, do not reflect actual results and are not guarantees of future results. Additionally, it is important to note that information in this report is based upon financial figures input on the article date; results provided may vary.
Search the Blog
Subscribe to the Blog
About the Writers

Zachary Abrams
Manager, Wealth Management & Portfolio Analysis
CFP®

Nathan Creviston
Manager, Wealth Management and Portfolio Analysis
CFP®, ChFC®, RICP®

Rob Holub
Chief Investment Strategist
CFA, CFP®