Narrow Market Returns

It seems crazy that the S&P 500 is closing in on an all-time high, given what transpired the first part of the year with the pandemic and the market down about -35%. Yet here we are.
However, when you look under the hood the positive performance is relatively narrow with a few asset classes leading the way. Of note, Large Growth companies are carrying stock market returns.
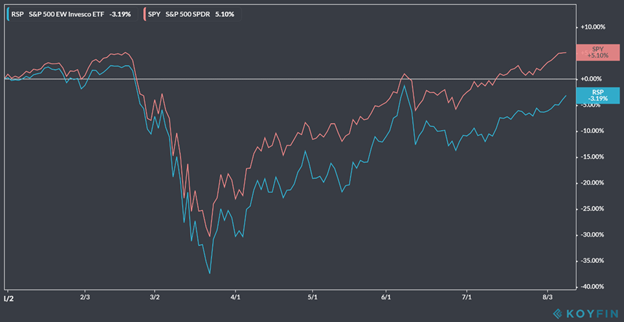
An easy way to see this is through the performance of the S&P 500, which is a market cap weighted index (i.e. larger companies make up a larger % of the index) versus an Equal Weight S&P 500 (i.e. larger companies make up an equal % of the index as smaller companies). Historically the Equal Weight index has offered higher returns over the Market Cap Index over longer time periods, but not this year.
Additionally, all other major equity asset classes outside of Large Growth have trailed the S&P 500. These include: Large Value, Mid Caps, Small Caps, Developed Markets, Emerging Markets, REITs, and Commodities. While Small Caps and International (and to a lesser extent Large Value) have picked up performance the last few months, the trend is still clear – Large Growth is dominating this market.
There is a Bear and Bull way to look at this. Bear = returns are concentrated so if/when Large Growth retreats it will take the market with it. Bull = plenty of room for the laggards like Large Value, Small Caps, etc. to catch up even if/when Growth retreats. Along the way to the bull or bear case, the market should provide some clues as to which way it’s heading.
For now, I side with the Bull camp. I feel that despite higher broad market valuations, presuming there is no second large-scale shutdown and a vaccine gets to market in the next 6 to 8 months, we could see the more cyclical parts of the market start to rally.
The views and opinions expressed herein are those of the author(s) noted and may or may not represent the views of Capital Analysts or Lincoln Investment. The material presented is provided for informational purposes only. Nothing contained herein should be construed as a recommendation to buy or sell any securities. No person or system can predict the market.
Past performance is not indicative of future results.
S&P 500: The index measures the performance of 500 widely held stocks in the US equity market. Standard and Poor's chooses member companies for the index based on market size, liquidity and industry group representation. It is market capitalization-weighted. Investors cannot invest directly in an index.
Equal weight is a type of weighting that gives the same weight, or importance, to each stock in a portfolio or index fund, and the smallest companies are given equal weight to the largest companies in an equal-weight index fund or portfolio.
Investing involves risk, including the loss of principal. There are some risks associated with investing in the stock markets: 1) Systematic risk - also known as market risk, this is the potential for the entire market to decline; 2) Unsystematic risk - the risk that any one stock may go down in value, independent of the stock market as a whole. This also incorporates business risk and event risk; and 3) Opportunity risk and liquidity risk.
Projections or other information regarding the likelihood of various outcomes are hypothetical in nature, do not reflect actual results and are not guarantees of future results. Additionally, it is important to note that information in this report is based upon financial figures input on the article date; results provided may vary.
Search the Blog
Subscribe to the Blog
About the Writers

Zachary Abrams
Manager, Wealth Management & Portfolio Analysis
CFP®

Nathan Creviston
Manager, Wealth Management and Portfolio Analysis
CFP®, ChFC®, RICP®

Rob Holub
Chief Investment Strategist
CFA, CFP®